From Raw Data to Dynamic Charts: How AI is Shaping Data Visualization
1. AI for Data Cleaning: The Foundation of Quality Data Visualization
Imagine a company collecting customer data: purchase information, reviews, customer service interactions, and so on. Do you know what's frustrating? This data is rarely “clean” from the start. It's often filled with errors, duplicates, or missing values. Manually cleaning this can take days.
That’s where AI changes the game. In no time, it scans millions of data lines, identifies anomalies, and corrects them. All automatically. It makes your data ready to be visualized. It’s like a conductor getting everything in order before the big concert. Once your data is cleaned, spotting insights becomes much easier. It’s the foundation of any good visualization.
2. From Automated Analysis to Predictive Visualization: AI Turns Insights into Actions
Imagine being able not only to see your company's past trends but also to predict what will happen in the coming months. AI no longer just presents data statically it goes further. For example, you can see a sales curve over the last three months. But with AI, you can also visualize a sales projection for the next three months, based on machine learning models.
Look at the chart below. It shows how AI projects sales trends based on past data. It’s much more than just a linear graph; it’s a real prediction based on thousands of data points.
These predictions are a huge asset for strategic decision-making. They keep you from navigating blindly. With just one click, you get a clear idea of the actions you need to take to avoid a performance dip or seize a future opportunity.
3. Dynamic and Interactive Visualizations: AI Enhances User Experience
Charts are no longer just static and fixed. With AI, visualizations become interactive and dynamic. Imagine you're in marketing and want to analyze the performance of several campaigns. Instead of browsing through dozens of different charts, you can directly explore a single interactive visualization.
Look at this example of an interactive chart. Each part of the diagram can be explored in real-time. Want to know why one campaign performed better than another? Just click, zoom, and uncover the insights hidden behind the numbers.
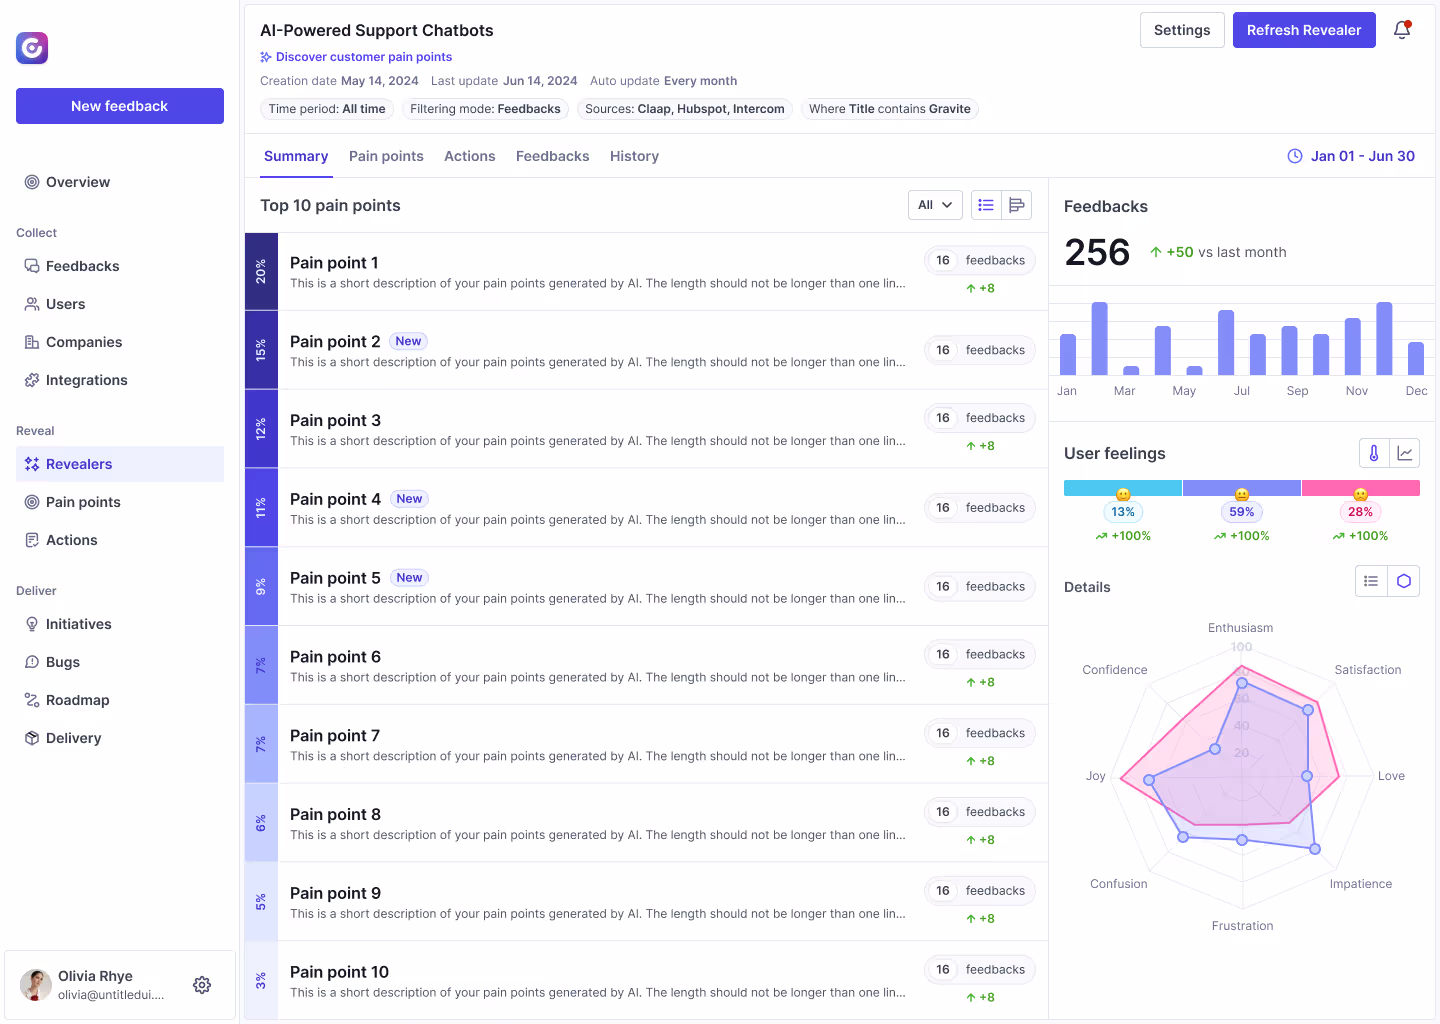
This flexibility allows any user, even without technical skills, to explore scenarios in real-time and understand the meaning behind the data. AI acts as an intelligent layer between you and your data, guiding you and showing you what’s relevant without you needing to search.
4. Personalized Visualizations: AI for Tailored Insights
Every company, every sector, and even every individual has different needs. What’s relevant to you may not be for someone else. Artificial intelligence understands this. It can tailor visualizations to your specific needs. For instance, if you’re a manager in e-commerce, your visualizations will focus on sales trends, buying behaviors, and conversion rates. But if you're a financial analyst, the data AI presents to you will be much more focused on cash flow and budget projections.
Imagine opening your personalized dashboard and immediately seeing the charts that speak to you without having to configure them yourself. It’s not science fiction—it’s the reality of Data Visualization AI today.
5. Case Study: How One Company Transformed Decision-Making with AI and Data Visualization
Let’s take a concrete example. An online retail company faced a problem with its conversion rates. The teams had tons of data on user behavior, but it was a challenge to understand why users were abandoning their carts. Thanks to AI, the company used data visualization to identify the exact moments when users left the site and predicted which customer segments to target to improve conversions.
The result? In less than six months, their conversion rate increased by 15%. The dynamic and interactive charts allowed their teams to make real-time, data-driven decisions and test different hypotheses without wasting time. AI gave them the ability to not only visualize what was happening but also act accordingly, quickly and precisely.
Conclusion: The Future of Data Visualization with AI
Today, Data Visualization AI is no longer a luxury—it’s a must for any company that wants to leverage its data. It not only helps you understand the data but also empowers you to take action. AI makes visualization more accessible, smarter, and most importantly, more powerful.
So, if you want to transform how you make decisions, it might be time to adopt a more dynamic and intuitive approach. With AI, you have all the tools you need to visualize and fully exploit the value of your data.